2 1 s t C E N T U R Y
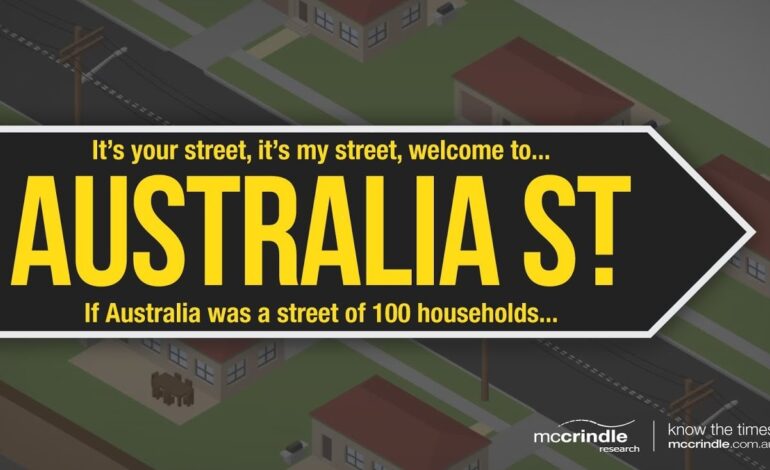
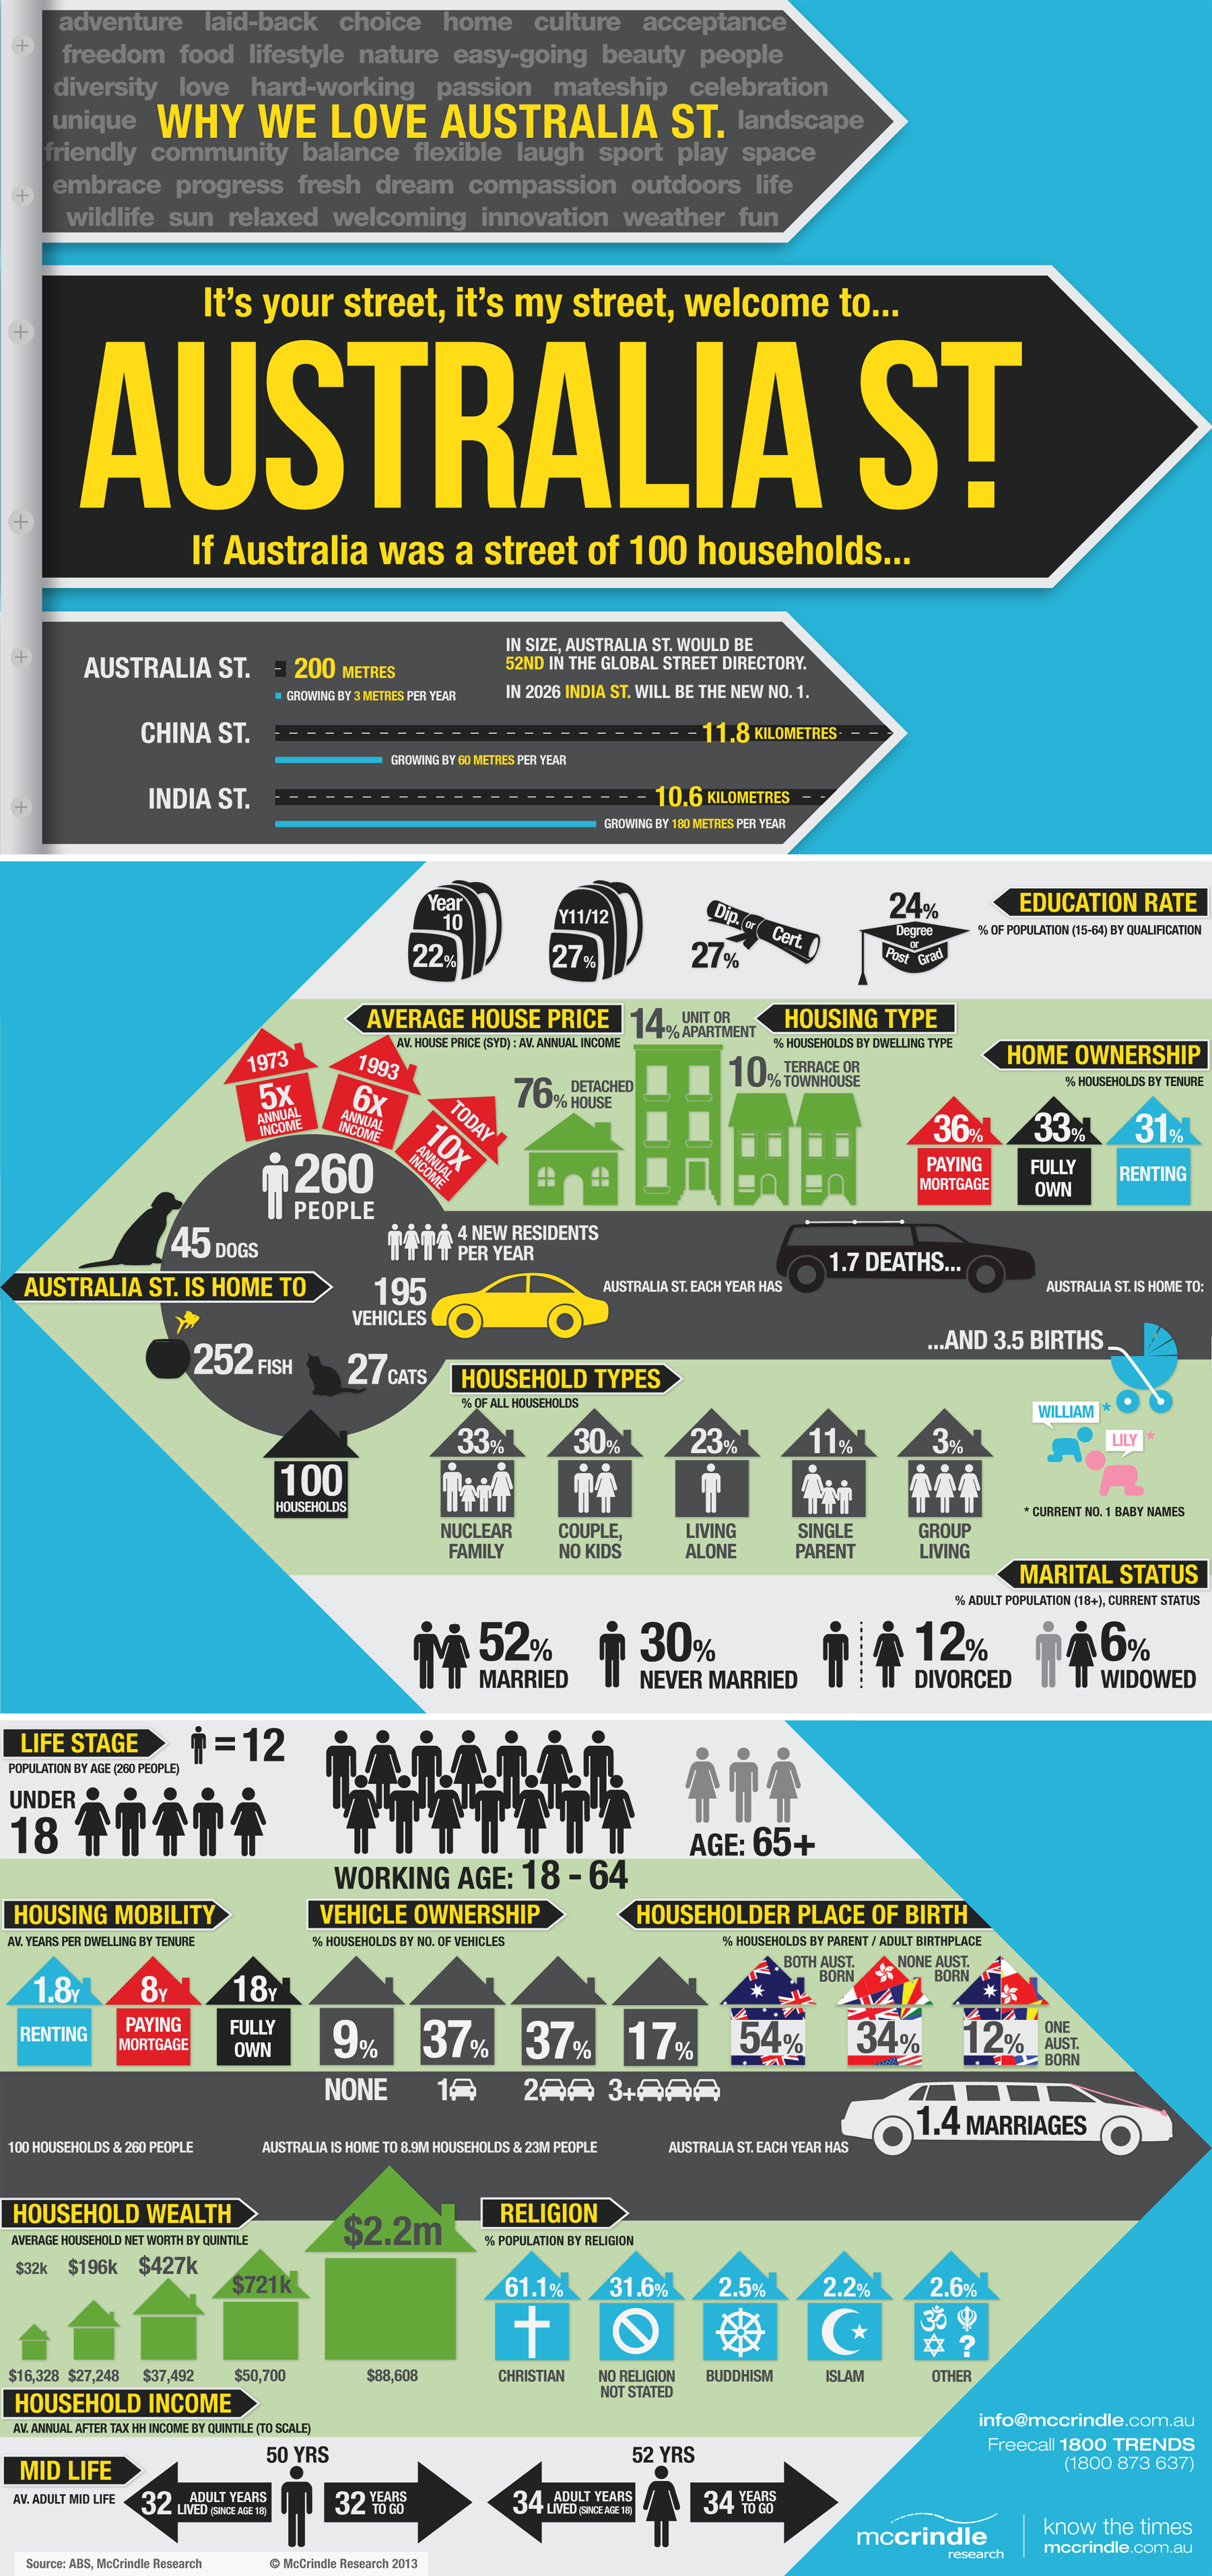
If you live on an average sized street in Australia comprised of 100 households, did you know that of those on your street there is a marriage, a death & 2 births every year!
These 100 households comprise on average 260 people, 40 dogs and 27 cats!
There are 160 cars owned on the street, which in total drive more than 2 million kilometers each year. Based on ABS data and other sources, and using this theme of Australia shrunk down to be a street of 100 households, we have developed the below infographic.
It is very interesting so enjoy the read:)
This feature provided by Mitchell Residential
Perth Real
DECADE OF AUSSIE CHANGE
Only occasionally in history do massive demographic changes combine with huge social shifts, ongoing generational transitions and unprecedented technological innovation so that within the span of a decade society altogether alters. Australia is currently in the midst of one such transformation.
Constant change can sometimes lead to change fatigue where the response can be to become worried about change, or equally negatively it can lead to change apathy which can create an indifference to change. However by understanding the emerging trends, we can be more prepared for the changes and so rather than becoming defensive or blasé we can confidently respond to the shifts and so remain ever-relevant.
MEGATRENDS RESHAPING AUSTRALIA
G R O W I N G
While Australia’s population growth rate we are adding more than a million people every 3 years. Australia’s largest city with over 5.3 million with Melbourne 5.1M. However Victoria is growing the fastest and will take Sydney’s title in 2030 with both cities expected to reach a population of 8 million in 2055. In fact Melbourne is growing by more people every 7 days than the state of Tasmania adds in an entire year (2,500). Our third and fourth ranked cities will also change order over the next decades with Perth’s rate of growth set to see it overtake Brisbane in 2030 when they both reach a population of 3 million. West Australia is growing by 500 per week 25000 per year new residents. While only these 4 cities currently exceed 2 million people, Adelaide will join the 2 million club but not until 2050, almost a century after Sydney reached this milestone in 1959.
M O V I N G
This population growth is leading to more densified living. While 3 in 4 households currently live in a detached home, almost half of all new housing approvals are in the unit, apartment or townhouse category. Australia’s communities are undergoing significant transformation from the horizontal suburbs to the growth of these vertical communities, and as people rent more, move more frequently, and transition across more communities than ever before. The average renter in Australia stays just 1.8 years per abode and even those who have bought a home are not putting their roots down deeply and staying for several decades like their parents did. Those with a mortgage stay on average just 8 years before they sell. While this growth, density and mobility is evident in the capital cities and larger coastal cities, Australia’s top 30 cities now include many inland regional cities that have a growth rate exceeding that of some of the capitals. It is the tree change and not just the sea change that rising capital city house prices is currently facilitating.
C H A N G I N G
Cultural diversity is foundational to Australia- part of the DNA of our communities. More than 1 in 4 Australians was born overseas and almost half of all households (46%) have at least one parent born overseas. And our population mix is now more connected to our region with the top 7 countries of birth of Australians born overseas shifting in three decades from mainly European countries to now include China, India, Vietnam and the Philippines. There remains a deep affection for the traditional Aussie qualities of mate ship, ironic humor and the larrikin spirit alongside the richness of our lifestyle which comes through the input of so many cultures. In a nation of world cities and global connectivity, gone is the cultural cringe, replaced with an international perspective that looks out not in.
T R A N S I T I O N I N G
Australia’s generations of Baby Boomers and Generation Xers are now sharing the leadership and workforce roles with the emerging Generations Y and Z. These new generations, born and shaped in the late 20th Century are increasingly becoming lifelong learners, multi-career workers with a focus on work-life balance, participative leadership models and a more varied job description. Along with this, the next generation of technology has, in less than a decade, transformed almost every area of business and consumer interactions. How we shop, where we get information from, when we connect and where we work from have all been fundamentally changed in this Wi-Fi-enabled, device-driven, app-based, social media-influenced decade. While it is self-evident that every business, product or idea is just one generation away from extinction, such is the speed of change today, we are now just a decade or perhaps a few years away from this point. While such change impacts us all, those who understand the trends can drive the change and shape the future.
A G E I N G
Three decades ago Australia’s average age had only just moved out of the 20’s to reach 30, today it exceeds 37 and in three more decades it will be 40. This ageing population though is a good news story- it means we are living longer, and consequently active later and able to work later in life than was previously the norm. In the last generation, Australians have added an average decade to their life expectancy at birth. Along with the ageing population goes an ageing workforce- which means that there are more generations in the workforce than ever before and leading teams in diverse times requires better people skills to bridge more gaps than ever before.
WHAT IS SHAPING OUR BUILT ENVIRONMENT?
The first is population growth. Australia has just reached 24 million which means we have added an extra million people in less than 3 years, and most of this growth is in our larger capital cities. This is creating a shift from suburban to urban living; from the traditional horizontal communities to the new vertical ones. In our largest capital cities, two-thirds of all new housing approvals are high or medium density rather than detached homes. This densification is creating walkable communities, multi-use areas where people live, work and play in a more localised space, and of course increased access to transit and transport hubs. The other factor shaping developments is affordability. With rising house prices, Australians are looking for financially sustainable options which meet the needs of both lifestyle and affordability, and create the flexibility for our homes to change in tune with our needs and lifestyles.
WHAT ARE THE CURRENT TRENDS AND WILL THEY LAST?
While design trends come and go with the changing fashions, there are some broader development trends that are here to stay. The increased access to open spaces, in-door out-door areas, balconies, natural light and bringing vegetation into urban environments are all timeless trends that resonates with our temperate climate and needs. Similarly, with food central to our social environment, open-plan kitchens and meal areas in homes and open social spaces in offices are trends we will see continue.
HOW IS TECHNOLOGY AFFECTING IT?
Today’s technology is seamlessly integrated into our lives, and we are seeing the same seamless integration into our homes. The internet of things means that lighting, sound, temperature, entertainment and security in our domestic environments are all manageable through our personal devices. The decade ahead will see our pantries and fridges talk to our devices to update shopping lists, our home entertainment experience continue playing seamlessly on our portable devices and our hydrogen cars help power our homes.

WHAT ARE THE DEMOGRAPHIC TRENDS?
Homes of the future will have the flexibility to accommodate multiple generations living under the one roof. They will meet the changing needs of a more culturally diverse community and have clever innovations to facilitate support to Australians living independently in their homes to a much older age than we currently see.
WHAT DOES THE FUTURE HOLD?
While Generation Z, who are just starting their careers, will have to pay more for their homes in the future, these buildings and the built environment in which they sit will far exceed what their parents experienced in their first homes. Not only will the technologies and fittings in the home be exciting but the community spaces, café culture and neighbourhood amenities will continue to adjust and adapt to meet the lifestyle expectations of the 21st Century generations.
WHAT MAKES A CITY THE MOST LIVEABLE?
What makes a state or city liveable? Is it the low crime rate, affordability, ease of travel or is it simply the weather? We have compared some of the major factors and revealed what Aussies really think.
AFFORDABILITY
If you take the average weekly earnings, subtract the average weekly mortgage repayments based on house costs, you find that NSW doesn’t do too well, it is earning 20% above the average, but the houses are 64% above the average, so NSW works out to be the worst in terms of income after housing. But WA is on top of the charts, with the ACT doing pretty well also.
EASE OF TRAVEL
We took the centre of population of each of our capital cities, the mid-point of the population sprawl where as many people live north, as south of this point, and as many east, as west. From this centre of living we measured the average, non-peak hour driving time to the centre of the CBD marked by the GPO of each capital. We found that as we would probably expect, Sydney was the longest drive, about 33 minutes to get from the centre of population to the centre of the city, but the quickest trip of all was Brisbane with just 8 minutes.
CRIME RATES
This is the number of offenders per annum, per 100 people and the Territories book end the data here, with the ACT with the lowest crime rate nationally and the Northern Territory as the highest crime rate and the other states right in the middle. As measured by crime rates, the ACT is Australia’s safest place to live.
WEATHER
We measured this by looking at the average number of sunny days – totally clear days in a year. Tasmania not doing too well with a lot of cloudy, overcast days, but WA takes the crown with the most number of sunny days in any given year.
POPULATION & RENTAL FUTURE
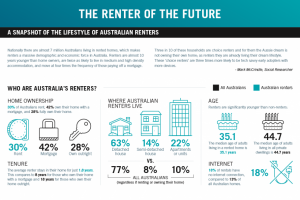
The rental market in Australia is growing in demand & a never ending need. In WA migration & natural population growth is the highest in the nation at a rate estimated just over 80,000 per year . This will mean the national average of rented properties 30% will be exceeded. Investors in the right locations around the city & coastal districts will be a developing trend in this state. An interesting snap shot below of the national rental future.

How does any of this affect your property.
Real Deal Australia
Complimentary Consultation by Appointment.
e : realdeal@iinet.net.au
w : realdeal.com.au
- Information provided in this feature from an editorial produced by the McCrindle company.


